Automatic dataset preliminary analysis in Mathematica
Nowadays, we live in an era of information explosion. And from time to time, we may need to do some some analysis of these data. Luckily, we have tools like Tableau or Qlik for analyzing and visualizing these data, but still it is time consuming and even tedious to dig into the dataset to find out what is worth showing in the visualization.
Be a programmer, I’d like to automate as much as I can in any task(or in other words I am lazy). So I decide to automate this process, thus I build a dataset automatic preliminary analysis tool to help me explore dataset.
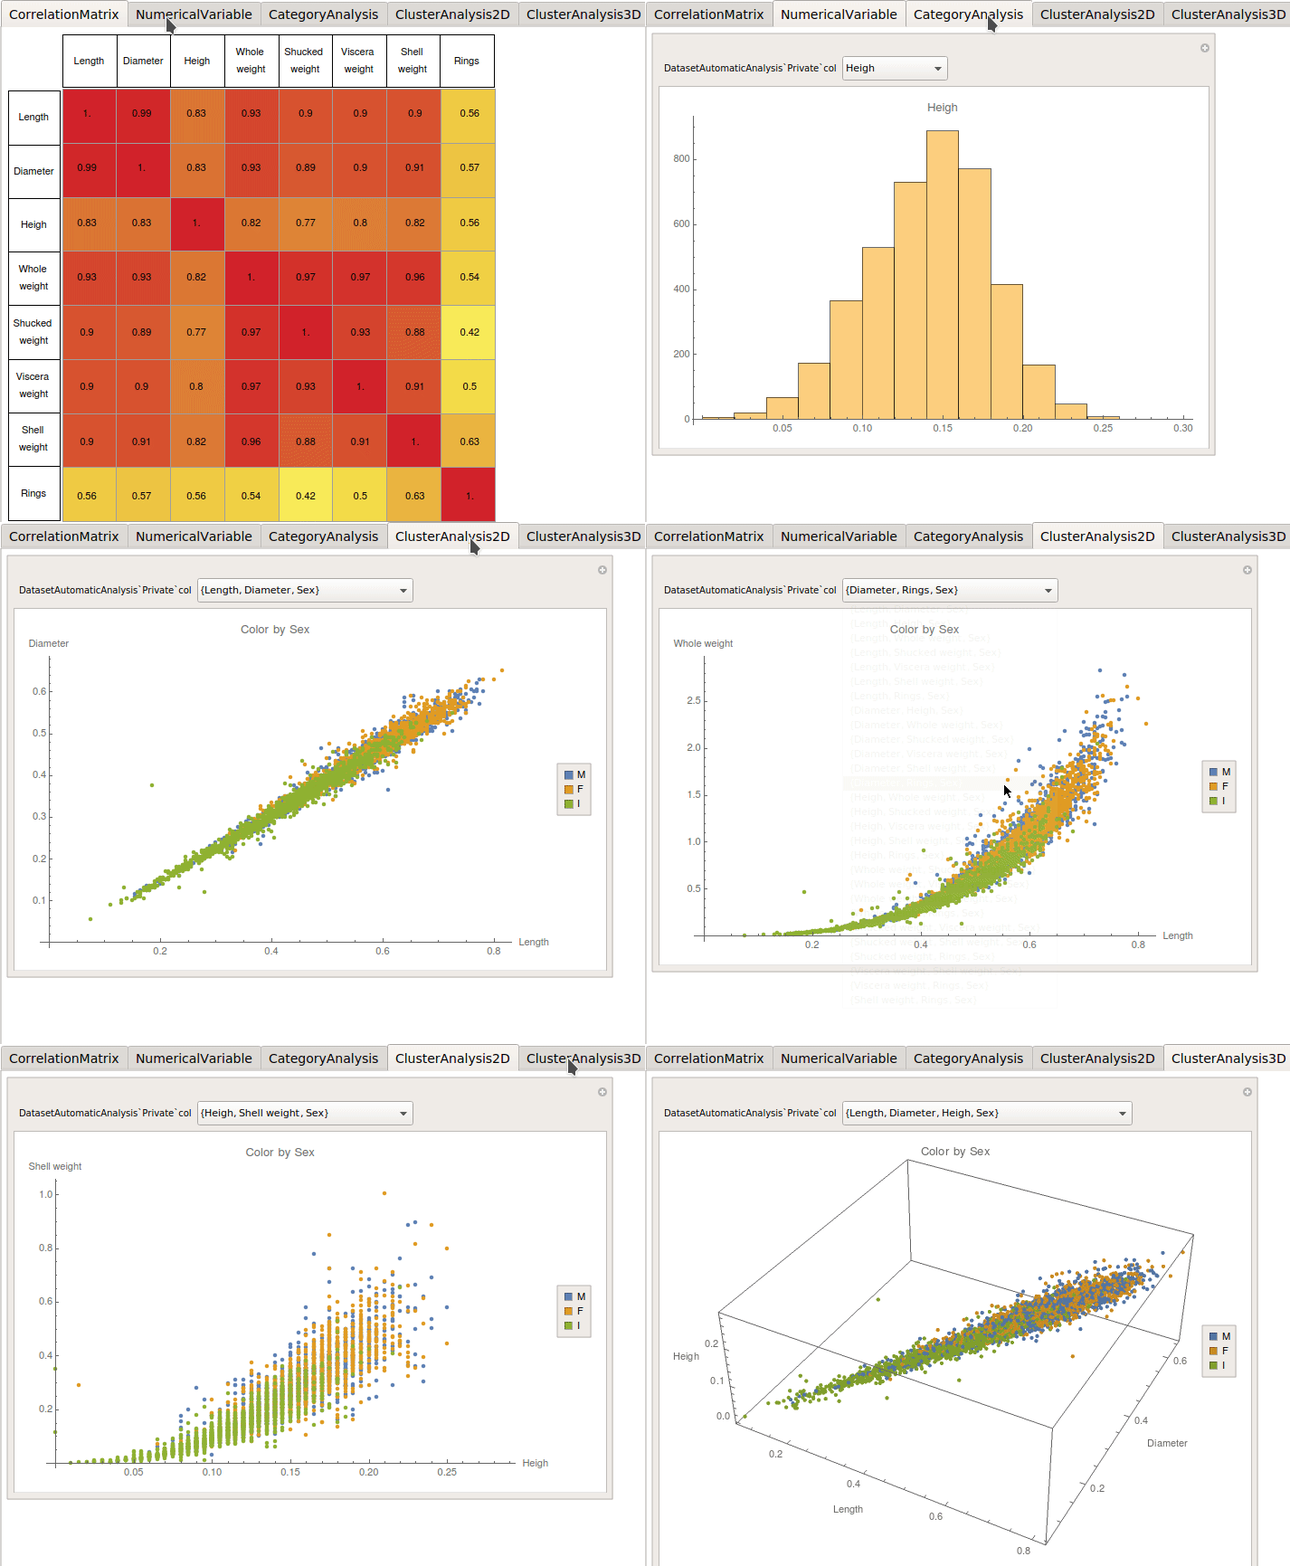
Here are some screenshots:

The dataset can be find here. The tool can basic numerical, category, correlation visualization, and it can also do cluster analysis in two and three dimensional space as show in the screenshot.
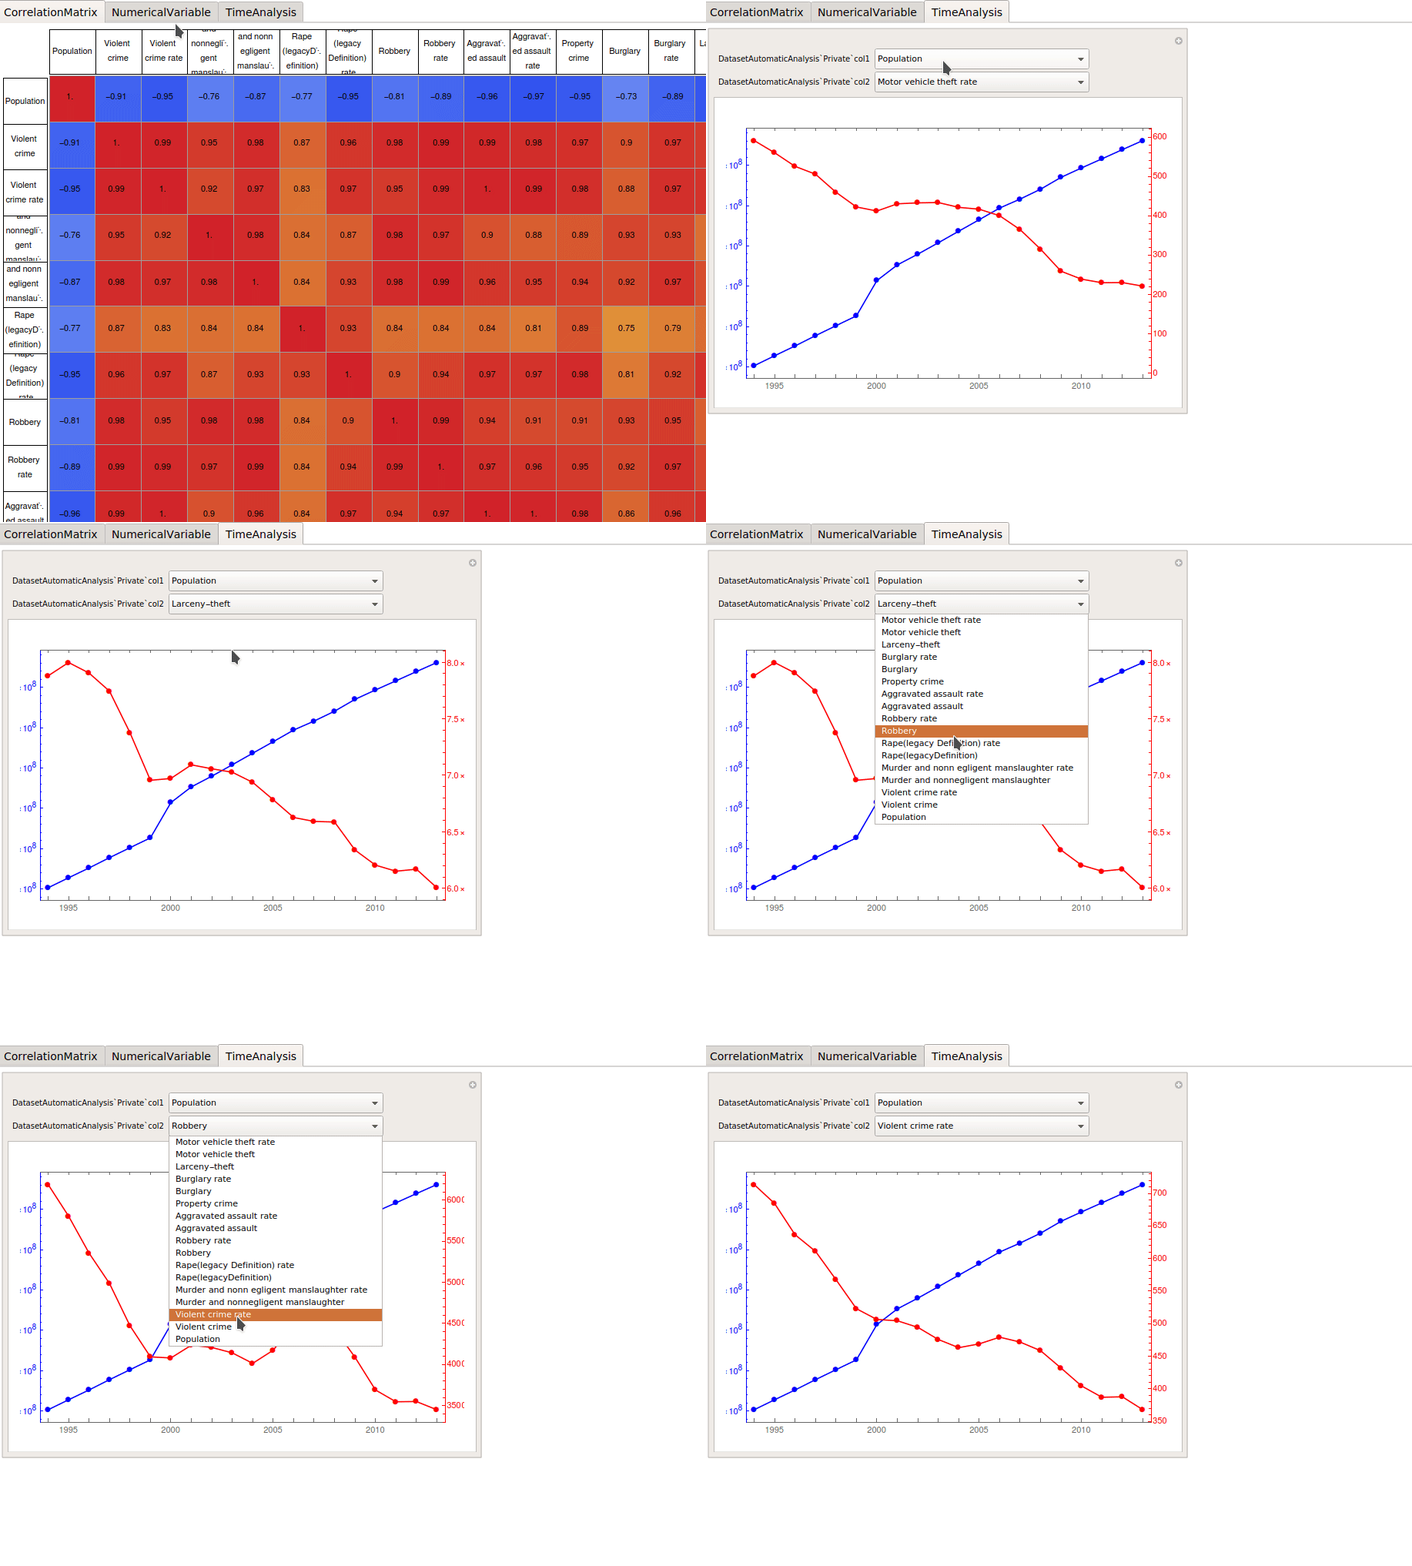
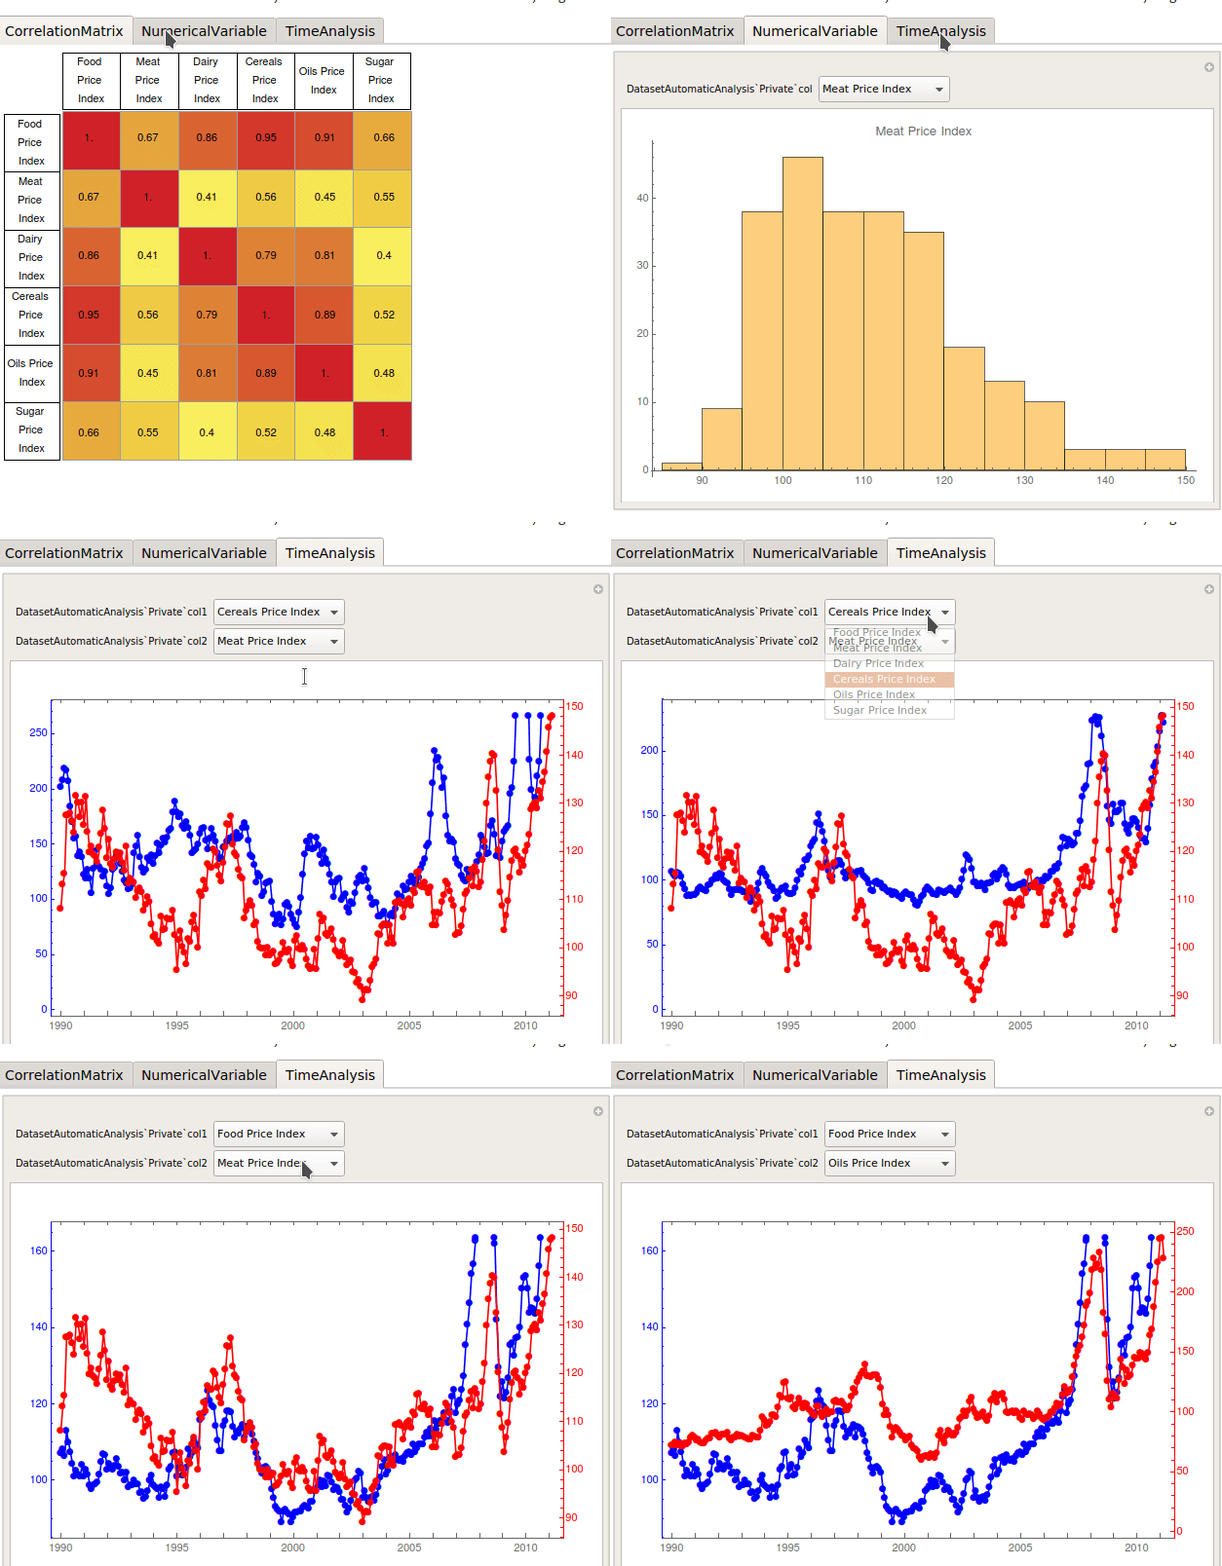
But it can also do analysis on time series data, as show in the following screenshots.


From these visualization, we can see that since 1994, all type of criminals in US steadily drop. While in the food price example, although generally it seems that all price has a quite high positive correlation, but in some specific time period, some price may have different trends, like in the early 90s, the meat price drop significantly while the oil price increase, same for meat price and sugar price from 1993 to 1995.
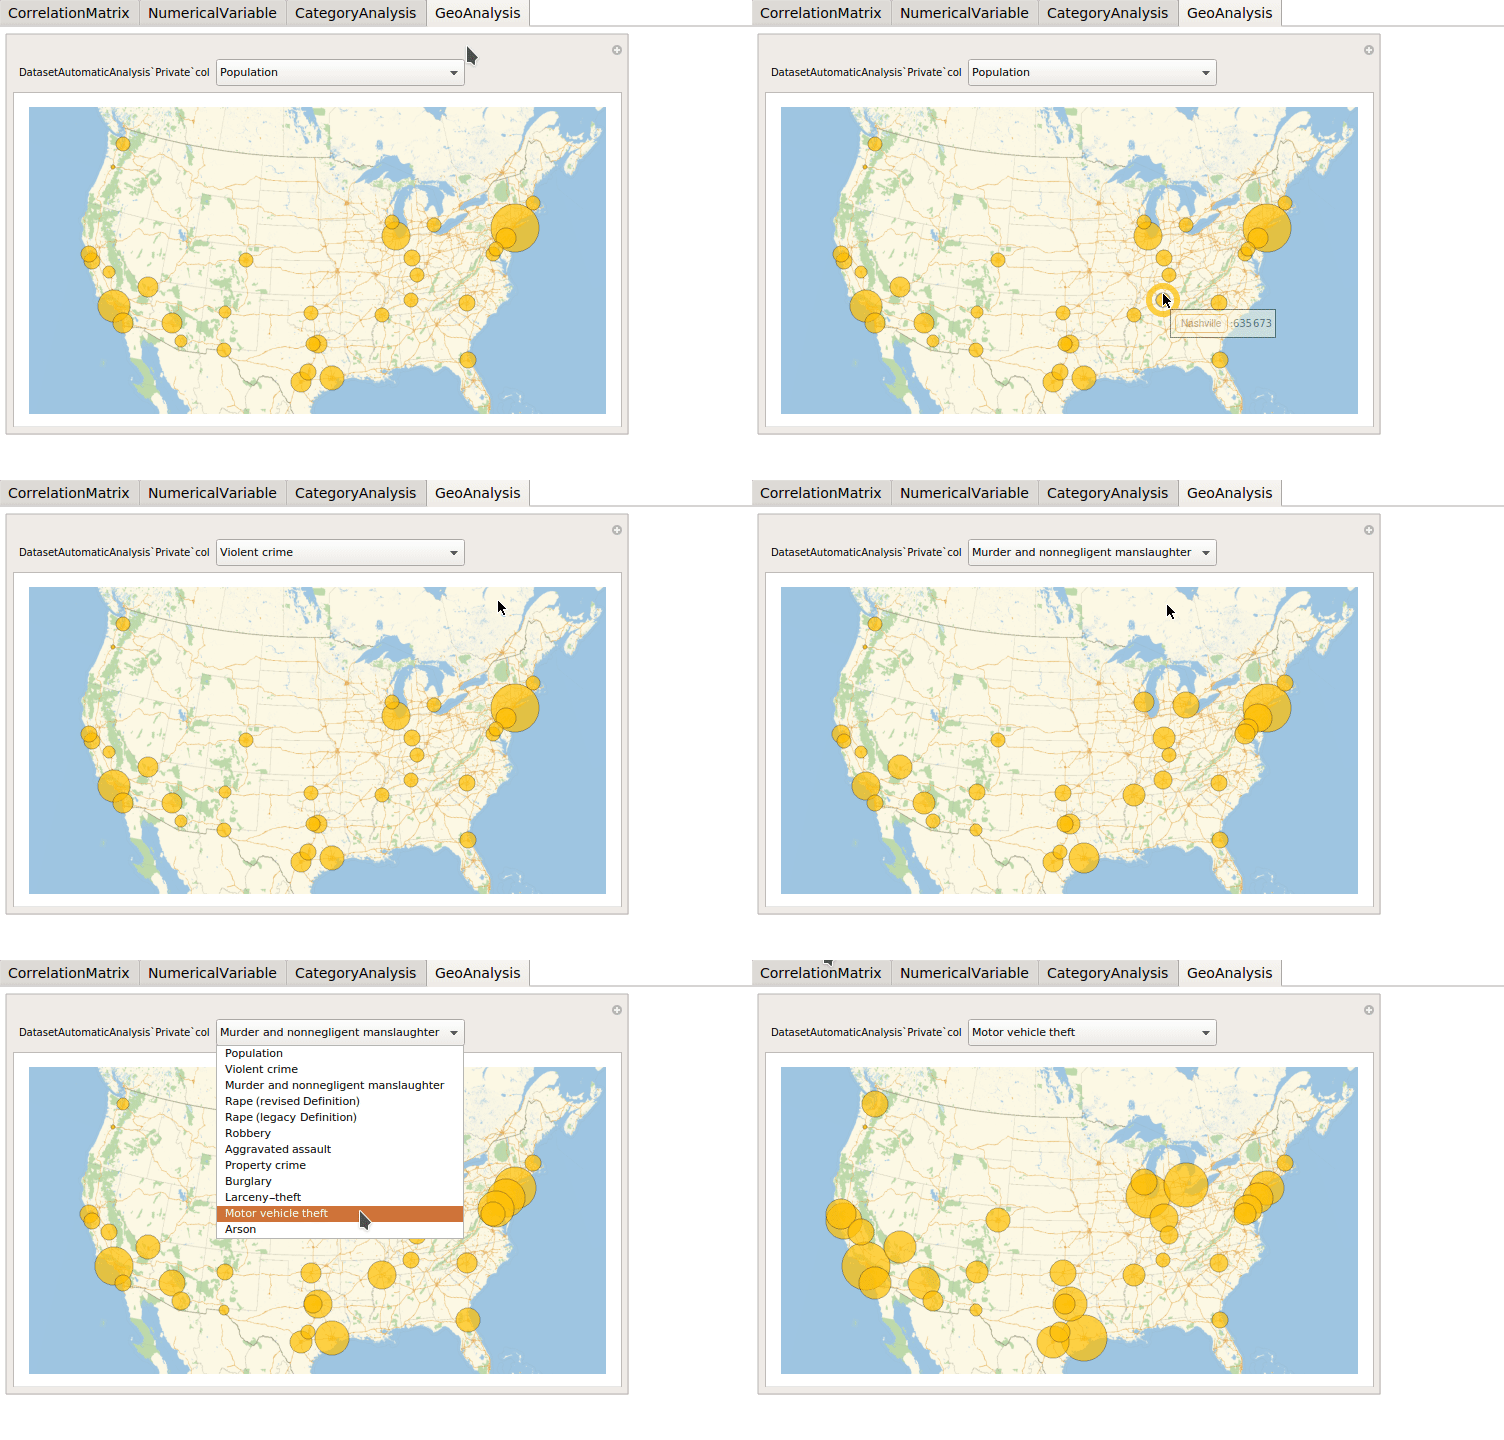
Not only that, it also support geographic entities like cities, countries etc. For example, the following image show the analysis of cities with more than 500,000 people in US, and do a plot on the map.
 .
.
It is very clear from the visualization that the mid north part of US has a a much higher rate of murder like criminal, while the south east part of US like California has much higher rate of motor vehicle theft.
This tool does not intend to eliminate all kind of work in exploring a dataset, something like data cleaning, make the dataset a proper format is still need to be done by people. But at least it can help me to quick explore the dataset and help me to identify what need some further analysis for more deep insight.
m00nlight 14 February 2018