White Noise or not, does the stock prices have long term memory
Traditional efficient market hypothesis(EMH) assume the fluctuations of stock market accord with normal distribution, which is widely know as a wrong assumption. In this post, I will show you the stock prices not only do not fit into the beautiful bell curve, but also has long-term memory.
Some backgrounds
What is efficient market hypothesis(EMH)
Efficient market hypothesis assume that the market fluctuations are random, thus no one can outperform the overall through selection of different stocks. But we always see there are some people who can constantly beat the overall performance while most of others do fairly worse most of the time.
And accroding to this theory, huge fluctuations should be extremely rare in stock market(due to the nature of Gaussian distribution), but we frequently see extremely huge fluctuations all the time(far more often than we expect).

Normal distribution
Why EMH not work
Many people attribute this to the fact that the stock market isn’t so efficient, since there is problems like information asymmetry, news leak etc. But it still can not explain so many crisis and bubble of mature market like US stock market.
From my point of view, the problem of EMH is that stock market system, like many other systems in the nature, are actually complex system. We can not only use purely mathematica formula or differential equations to model this system.
As a form of complex system, stock market contains a lot of characteristics commonlly seen in other complex system. Like:
- Cascading failures(when stock prices crisis, more people sell their stock, which cause even steeper crisis)
- Non-linear relationship
- Hierarchical organization(there are banker, fund company, individuals investors etc.)
- Emergent phenomena
- Relationships contain feedback loops
- …
The following picture shows the quntile plot of n days’ accmulat earning of Apple and Microsoft stock prices. I choose the two since the former represent a stock with roaring growth in the last few years, and the other is quite stable during the last decade.
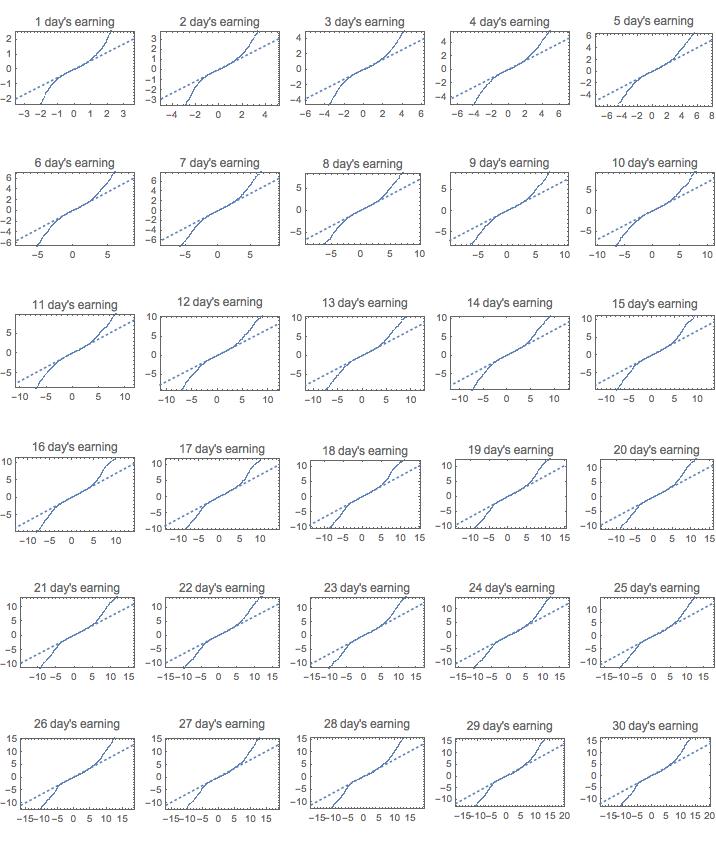
Apple Quantitle plot of accumulate earning from 1 to 30 days
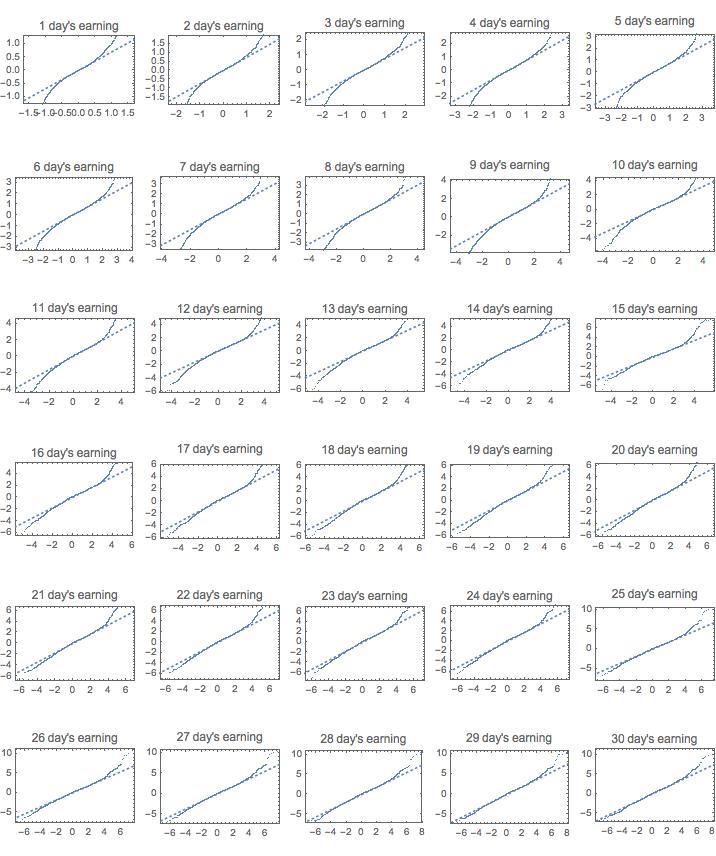
Microsoft Quantitle plot of accumulate earning from 1 to 30 days
The better the plot fit to the dashed line, the more random walk(or white noise) it is. As we expect, microsoft has better fit than Apple, especially when n is large(since it is more stable). But it is still by no means indicate that the fluctuations is a normal distribution. See the two ends of the plot, they drift off the dashed lines a lot, which indicate big fluctuations(bubble or crisises) occur more more often than what a normal distribution has.
So what?
Even if we accept that stock fluctuations do not follow the normal distribution, what does it actually meaning? Can we have better model to describe the stock market?
The answer is yes. We have some techniques to show that the stock market does actually have some type of long-term memory, which is called Hurst Exponent.
Hurse Exponent Definition
In short, Hurst Exponent is just a fractal dimension for time series data. It is a meansure of long-term memory of the time series.
The strick definition of Hurst Exponent is as following:
where is expect value, is the range of the first n value, , is the standard deviation of the first n values and n is the observation span.
The meaning of in different ranges are as follow:
- means the sequence has long-term switching between high and low value, which means a high value will normally have low value as next and vice versa.
- means the time series is uncorrelate, or more techniquely, a random walk process
- means the series have positive correlation, which means a high value will probabily follow another high value and vice versa
Steps to estimate the Hurst Exponent
Like most parameters in fractal, Hurst Exponent can not be simply calculated. We normally use some other techniques to estimate the value like box counting in fractal dimension estimation.
Because Hurst Exponent is some type of power law, there are normally two methods to estimate the parameter, one is to use log-log plot of the data, and do a linear model fit to evaluate the exponent, another is use maximum-likelihood fashion. The former is know to produce biased power law exponent estimation, but since it is much simpler, I will just use it in this post.
The basic idea is to use different range span n to calculate the value of and , and calculate the log of the expect value, do the same of for the same. And plot the point in a two dimensional plan, and do a linear model fit to the data, the slope of the line will be the Hurst Exponent.
Here is the pesudo code:
def hurst_expoent(xs):
    def hurst_r(xs):
        m = mean(xs)
        # if xs = [x0, x1, x2, .., xn-1] then accumulate(xs) = [x0, x0 + x1, x0 + x1 + x2, ...]
        ys = accumulate(map(lambda x: x - m, xs))
        return max(ys) - min(ys)

    def hurst_s(xs):
        return std(xs)

    def hurst_rs(xs):
        if abs(hurst_s(xs)) <= 1e-6:
            return 1.0
        else:
            return hurst_r(xs) / hurst_s(xs)

    n = len(xs)

    line_points = []
    while n >= 2:
        xxs = partition(xs, n)  # partition the list into equal part of length n
        vs = map(lambda x: hurst_rs(x), xxs)
        line_points.append((log(mean(vs)), log(n)))  # base 2 log
        n = n // 2

    linear_model_fit(line_points)
I build an interactive demo in Mathematica to explore the result. You can try an online version by clicking here.
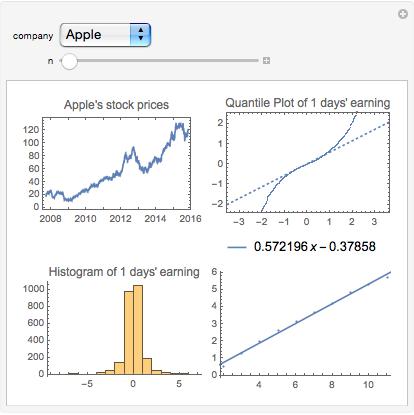
Apple's 1 day Hurst Exponent
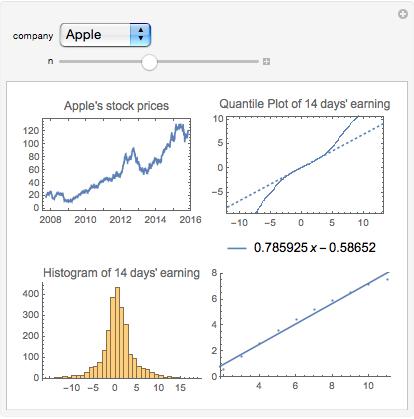
Apple's 14 days Hurst Exponent
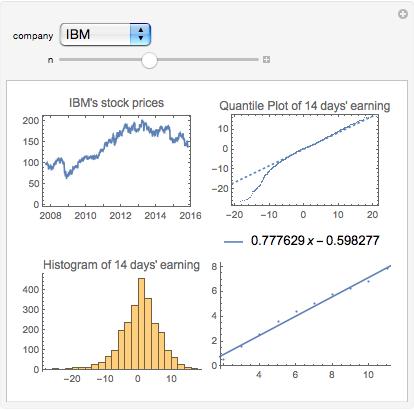
IBM's 14 days Hurst Exponent
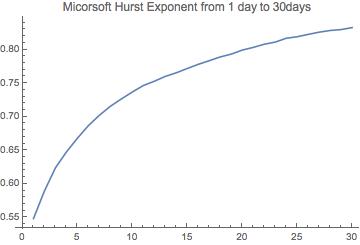
Microsoft hurst exponent value from 1 day to 30 days' return
And we can see that the larger the n, the bigger the Hurst Exponent will be, which indicate more long-term memory of the data.
Conclusion
From all the above discussion, we not only showed that the fluctuations of stock market does not follow normal distribution but also it has some type of long-term memory. I always believe the stock market is something tightly related with complex system, which can not described by some simple equations. The market is not simply the sum of every individuals in the market, and should be studied from a totally different point of view.
I think to view it as a complex system is a good start point, and in my point of view, fractal and complex system are two of the most important discoveries of the 20th century. They have radically changed the way we see and understand our world and can use to explain a lot of phenomena we could not only use math of physics previously.
Believe it or not, non-linear, fraction dimension and chaos are main roles in our daily life. We should embrace new thoughts from complex system to help us better understanding the world.
m00nlight 02 November 2015